Cannabis Retailers Experience Steady 4/20 Season, Marked Growth in Some Markets, Gentle Trend Upward in Others

Now that the dust has settled and the smoke has cleared, it's time to review some of the key metrics from this year's 4/20 holiday and see what they reveal about the cannabis market as a whole. Treez predicted that 2023 would be a year of stuffed orders, searches for savings, and swiping cards. Let’s check out some vital metrics from the 4/20 holiday and what they show us about the cannabis market in general.
Customer Count on 4/20
Overall, this year’s 4/20 saw almost 1.5x as many customers check out through a Treez point of sale system as last year’s celebration day.
Individual dispensaries on Treez POS on average saw about 2.3x as many customers on 4/20/23 as they did on an average day so far this year.
This year’s 4/20 holiday was slightly less attended for individual retailers as last year’s 4/20. On average, a dispensary was visited by 13.8% fewer customers than last year on 4/20. Are these statistics similar to your dispensary’s customer count for 2023 and 2022? Check under Transaction Count on your Sales Dashboard in the Latest Version of Treez to confirm.
What Was Treez Point of Sale Uptime on 4/20/23?
On 4/20/23, Treez Point of Sale delivered 99.99% uptime for our clients across the United States. Uptime describes the status of a service when it is online with no outages.
Downtime is the opposite - your system being unavailable, offline, or non-functional. If a point of sale system or ecommerce provider experiences hours of downtime in any industry, business owners feel it.
But in cannabis, hours of down time might mean you’re unable to accept anything but cash sales. Or it might mean that your business is out of compliance until you reconcile sales with state tracking software on your own. In the worst case scenario, customers cannot purchase products at all, causing you to miss out on hours of sales.
Most Popular Cannabis Product Types on 4/20/23
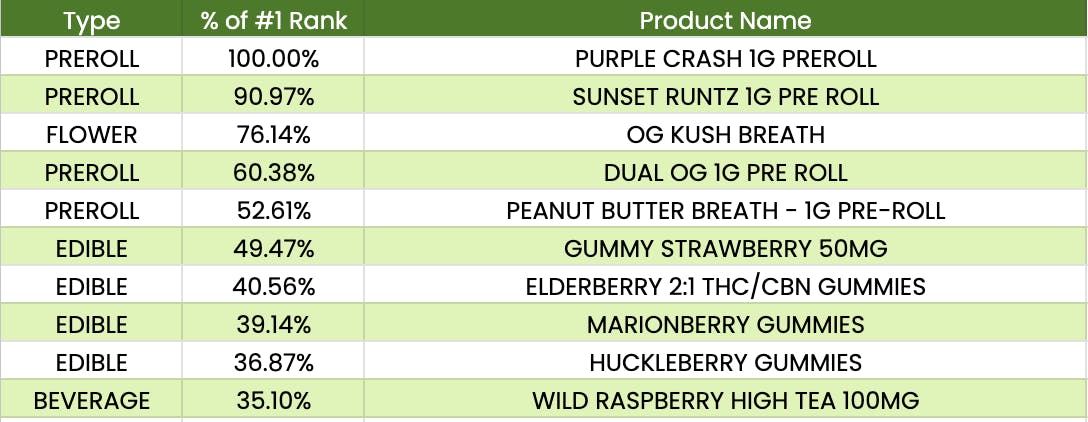
Just like in previous years, we’ve pulled the Top 10 Performing Products, anonymized their branding so we can share with you in a way that’s useful for all operators. Earlier this month, we looked back at the 10 most sold products for 4/20/22, by units, and what their product types were.

Comparing data from Treez retailers for 4/20/2023, we see more prerolls represented than flower in the top 10. All edibles present in the top 10 selling products by units were gummies. Last year, beverages didn’t break the top 10 but this year, a 100MG beverage took the #10 most popular spot in units sold.
The most surprising revelation is that cannabis flower took only one of the top 10 spots under units sold.
To check our data even more, we looked at the Top 25 most popular products by unit across all our retailers, to see if that product type assortment bore out amongst an even broader range of top performers.
Top 10 products: 4 prerolls, 4 edibles, 1 flower, 1 beverage
Top 25 products: 13 prerolls, 7 edibles, 3 flower, 2 beverage
It absolutely did. For cannabis smokers, prerolls were the way to go on 4/20. This makes sense when you consider that 4/20 day-of shopping is a celebratory activity, inviting casual consumers who may not smoke at all, or not enough to justify buying an eighth or more of flower. It also tracks when you consider that prerolls are often part of deep discounts and BOGO deals, on 4/20 and otherwise.

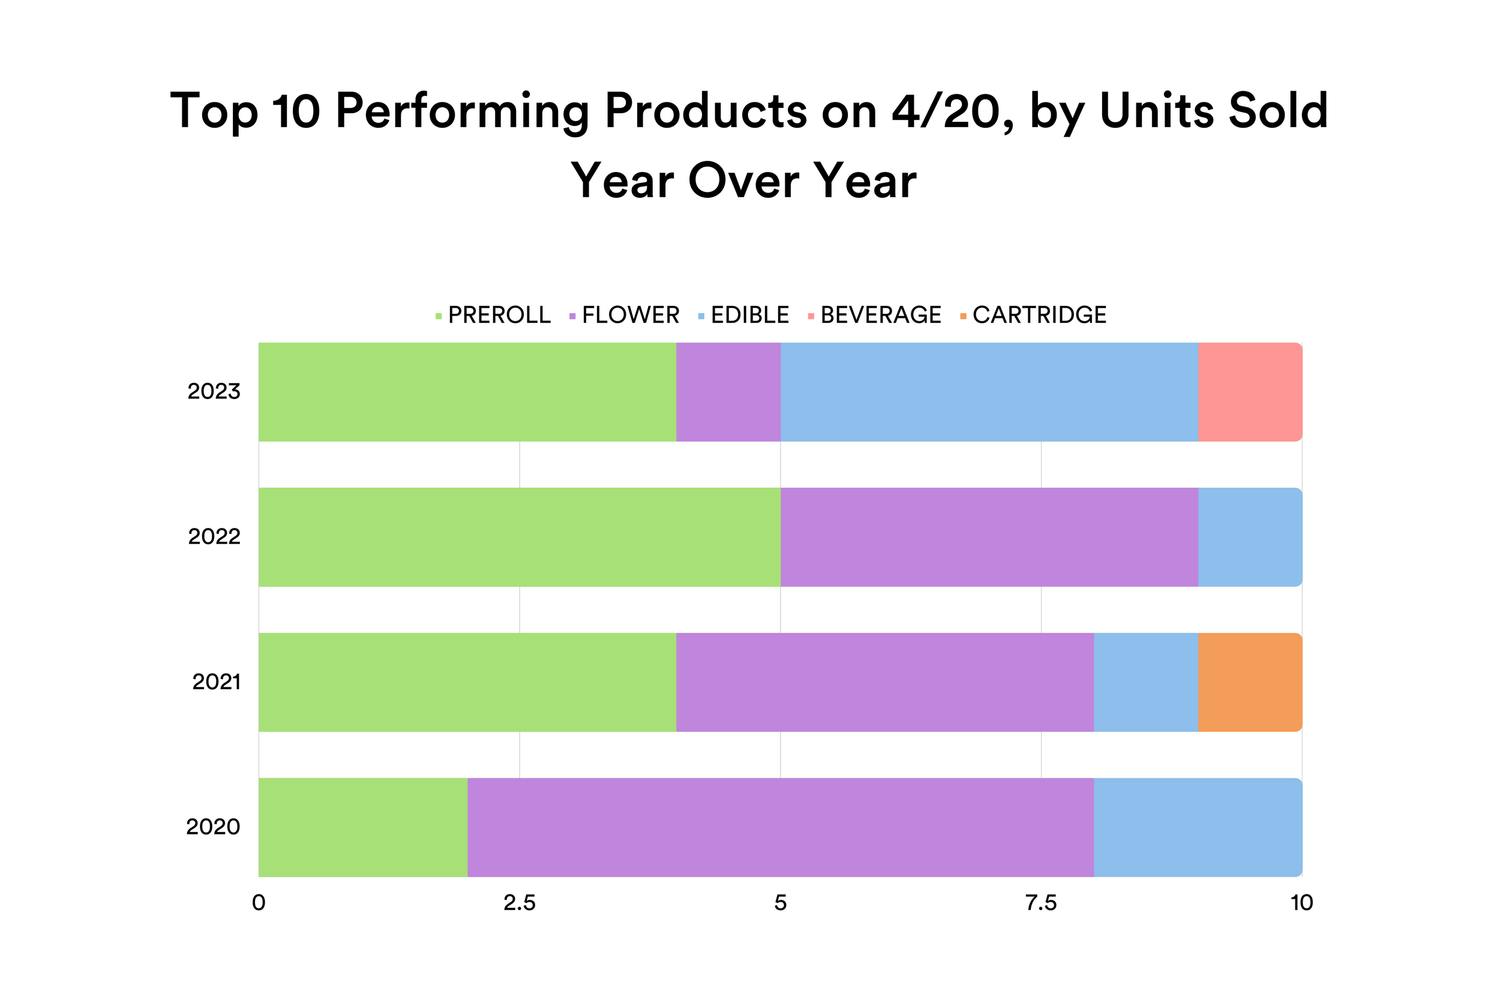
Comparing the year over year trends of the top 10 performing products, we see that preroll’s prominence is not the only product on the move. We also saw a beverage pop up on the top 10 for the first time.
Could that speak to the novelty seeking nature of the 4/20 holiday the way a cookie did last year? Or maybe beverages are finally finding their way into casual cannabis consumers’ minds.
We’ll keep an eye out either way.
Product breakdown, across all sales made on 4/20
When you’re looking at your store’s performance, you shouldn’t just know about its Top 10 performers. You have to check the total health of your entire inventory.
In that same way, Treez also pulled all units sold across all retailers to tease out category trends across every item sold on 4/20. Keep in mind, this data represents retailers all over the United States, so you’ll want to compare this data to state specific and store specific stats before you act on it for your store.
Here’s what we found:
- When taking all units sold across all retailers, it’s most likely that a cannabis consumer is walking away with some flower in their bag - that’s been true since at least 2020.
- We saw healthy increase in flower sales from last year to 2023, though not as big of an increase as previous flower sales YoY.
- The biggest increase in units sold from 2022 to 2023 was cartridges, which had a sales increase of 47%.
Given that no particular cartridge made it into the Top 10 products by units sold, we have to assume that cartridge consumers are pickier when it comes to their preferred brand and type, and might not be swayed by the Deal of the Day.
Product Ranking Across All Items Sold 4/20
2020:
- FLOWER
- EDIBLE
- PREROLL
- CARTRIDGE
- BEVERAGE
2021:
- FLOWER
- EDIBLE
- PREROLL
- CARTRIDGE
- BEVERAGE
- FLOWER
- EDIBLE
- PREROLL
- CARTRIDGE
- BEVERAGE
- FLOWER
- CARTRIDGE
- EDIBLE
- PREROLL
- BEVERAGE
Average Basket Size and Average Order Value
In this way, flower is still absolutely the number 1 seller as a product type. And beverages continue to be the lowest performer of these 5 categories. Despite their low ranking on this listing, beverage sales still increased by about 50% year over year from 2022 to 2023.
Consumers brought more products home than ever this year, with the average number of items per order climbing to 5.46 items on average. That’s up from last year’s Average Basket Size of 4.96 and surpasses the previous highest ABS seen on 4/20 of 5.26 items.
The average order value for 2023 sat about $4 lower than last year’s average though, at $85.61.
Consumers may be gravitating towards lower-priced products or looking for deals and discounts even more than previous years. Retailers should be cautious about a race to the bottom when it comes to discounting, as there will always be someone willing to cut more into their profits than you are.
Payments:
Swiping your card and receiving cannabis has never made more sense than on a busy, crowded 4/20 day. We saw consumers make that choice over and over this 420.
Cash, while still the top payment type across all markets, made up a smaller fraction of the entire payments pie this year. About two-thirds of transactions processed on Treez point of sale were done in cash. Last year that number was 70%.
On the other hand, we saw a marked increase in secure debit transactions, which made up 21% of payments used on 4/20 this year, up from 15% of payments in 2022.
Aggregate Sales
On average retailers on Treez saw 2.2 times more total revenue than an average day this year.
State Breakdown
Missouri celebrated its first 4/20 holiday since cannabis was legalized for recreational use. Across Missouri retailers this year, we saw 252% increase in total day-of revenue. That’s a difference between bringing in about $9,950 on 4/20/22 and then about $35,000 in 2023.
Other impressive aggregate growth in state markets served by Treez:
- 36% increase in total revenue in CA
- 195% increase in total revenue in CO
- 37% increase in total revenue in MI
With these stats, we see both the impressive performance of cannabis retailers and Treez’s growth in core and new markets.
Looking back at 420 2023, the biggest legal cannabis holiday of all time, we are impressed and excited. The cannabis market is continuing to grow and evolve, with new states joining the cannabis market every year and the popularity of certain product types and payment methods shifting over time. We hope this breakdown helps retailers feel empowered, with a starting point for analyzing their own store's performance and to make data-driven decisions for the future.