The Tool Every Dispensary Needs: Retail Analytics
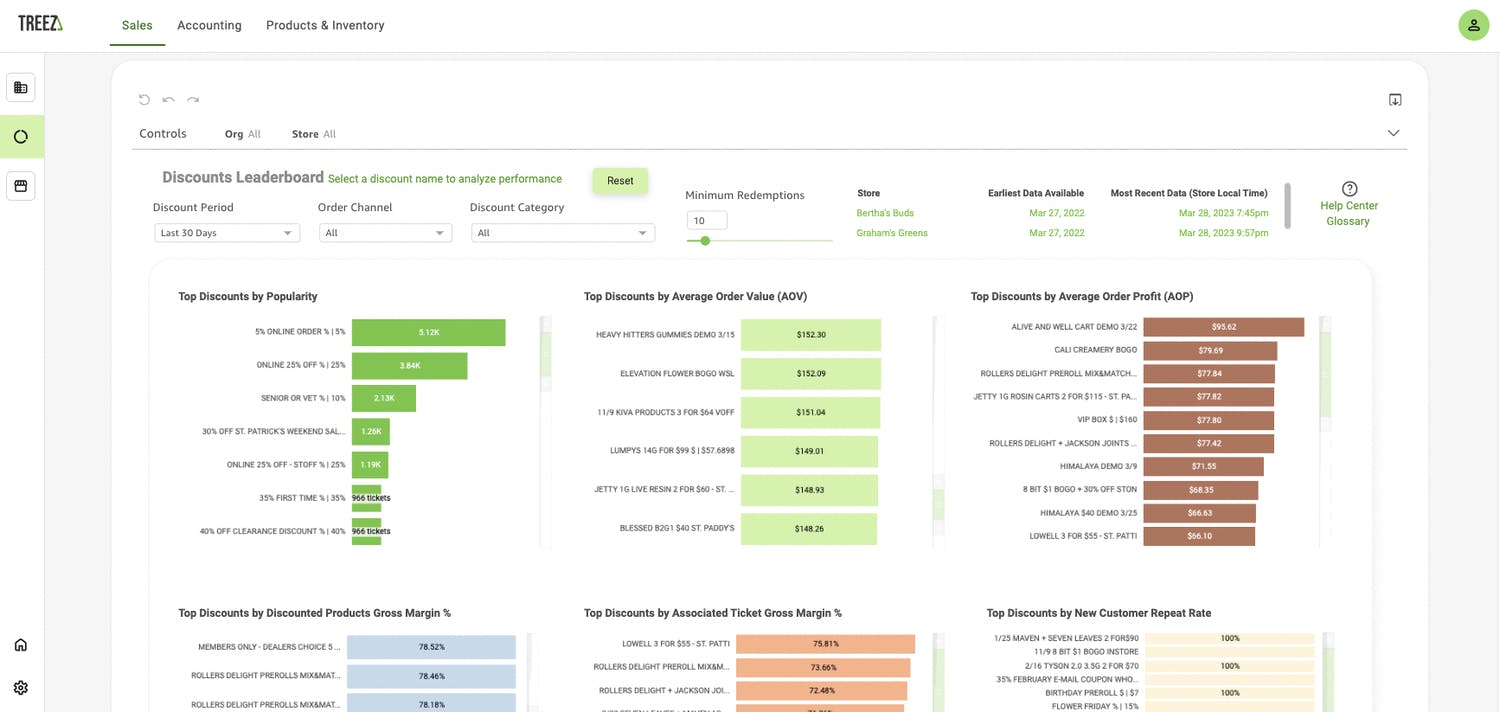
Running a dispensary in 2023 requires more than just intuition and guesswork. It demands decisive action and data-backed choices. Use the right tools to convert the potential of your data into informed decisions and achieve your goals. Image: Treez Retail Analytics
Think of every number involved in your dispensary’s day-to-day operations. Each one is a data point, representing a crucial piece of information about your store's performance. Collecting and finding ways to represent that data is how you can see the whole picture clearly.
Retail analytics is the tool that transforms complex data into easy-to-understand visualizations like graphs and charts. Used well, these insights help dispensary owners in critical tasks like tracking product performance, assessing the success of promotions, and monitoring customer behavior.
How can analytics help you make data-backed decisions? Imagine that it's been a slow month in your store. Running a special seems like the best thing to do. You’re not sure what else will get customers back in and spending, so you put out a sign offering a juicy discount as bait.
Sales do pick up in the next week – you think. The store feels busier, and you hear your budtenders offering the deal and customers taking them up on it. You’re excited to pull your sales numbers for the week, exporting them, and dumping everything into Excel. When you go to calculate your profits though, there’s barely been a change. You know that for the last week you’ve basically been giving away good product for free and have to shut down the special.
What’s more, these metrics shouldn’t be available to only a subset of your workforce. Well-designed analytics tools will take into consideration that each employee is a stakeholder in your dispensary and holds a key to your success. These tools will have specific reports designed for specific departments: inventory performance for your general manager, budtender performance for your FOH manager, and even specific reports designed for budtenders to assess their performance, brand bias, and store status.
Powerful and intuitive reporting should ideally be available directly inside your point of sale. The best tool will be streamlined and designed with the dashboards and reports you need from the beginning. Some of unique metrics you should be able to easily find and track inside a high quality analytics product include:
- sellable velocity - how many units of a product sold when it was in a sellable location (not in a vault, or quarantine, etc.)
- sellable units left - total amount of the products left that are in the sellable location
- average order profit - the average profit per order, should be available for a store, a time period, or a budtender’s individual performance
- average transaction time - the average time elapsed between the beginning of a transaction at a sales counter and the completion of payment, should be available for a store, a time period, or a budtender’s individual performance
- new customer repeat rate - what discounts attracted new customers who returned and used the same deal
Extra bonus points if you can access your metrics on-the-go via a phone or tablet. That accessibility makes it easy to make informed decisions wherever you are, whether you're on the sales floor or offsite.
With retail analytics, you can harness the power of the numbers you encounter every day to make wise business choices, increase sales and customer loyalty, and improve your overall strategy. You can stock your shelves with the right product, in the right assortment, and purchase that product from suppliers at the right price. You can empower each level of your business to work towards common goals and better performance.
Running a dispensary in 2023 requires more than just intuition and guesswork. It demands decisive action and data-backed choices. Use the right tools to convert the potential of your data into informed decisions and achieve your goals.
Ready to upgrade your data and insights? Book a customized demo to see where Treez Retail Analytics can take your dispensary.
Book a demo
Current Treez customers, reach out to your CSM to learn more about upgrading to the latest version of Treez.